
Observing My Homelab Like It's Production
- Nicolas Takashi
- Observability , OpenTelemetry , Kubernetes
- November 22, 2026
Table of Contents
Like any good nerd engineer, I have a homelab 🤓 It’s a 2017 machine, a Ryzen 5 2600 with 48 GB of RAM and a Radeon RX 580, that I bought pretending I was going to play games on it. Silly boy. Spoiler: it barely saw a game. Today it runs a three-node Kubernetes cluster, and that GPU spends its days running an LLM instead of rendering frames.
And that’s the whole point of a homelab: run software, learn and experiment. Nothing is overkill when everything is a lesson. This time, I wanted to find out how much of a stack like this you can observe with only what each component already ships with, without adding SDKs or writing a single exporter.
Turns out, quite a lot.
Info
This is the first post of a three-part series. The next two are about observing a local LLM running on that 2017 GPU, and tuning it with nothing but telemetry. Full disclosure: I work at Dash0, and this lab is where I play with it outside of work.
The lab, in one paragraph
That Kubernetes cluster is k3s on three Ubuntu VMs in Proxmox: one server, two agents. Terraform creates the VMs and installs k3s, then ArgoCD takes over and runs everything inside the cluster from a git branch, ArgoCD included. Renovate opens PRs for chart and provider updates, secrets come from 1Password and never touch git, and certificates come from Let’s Encrypt over DNS-01, so nothing is exposed to the internet.
Nothing exotic. Which is exactly why it’s a good test: if observing this takes a lot of custom work, observing your stuff will too.
Why bother?
A lab like this comes with plenty of screens: the Proxmox web UI, the ArgoCD UI, kubectl get pods. They work, until you ask a question with the word why in it. Why did that pod restart at 3 am? Why is the disk on one node filling up? Why is ArgoCD slow to sync today?
I wanted the same thing I want at work: every layer, from the physical host up to a single HTTP request, in one place where I can query it and jump from one signal to another. That place is Dash0, so everything in this post ends up there: metrics, logs, traces and alerts.
Layer by layer
The host: Proxmox already speaks OpenTelemetry
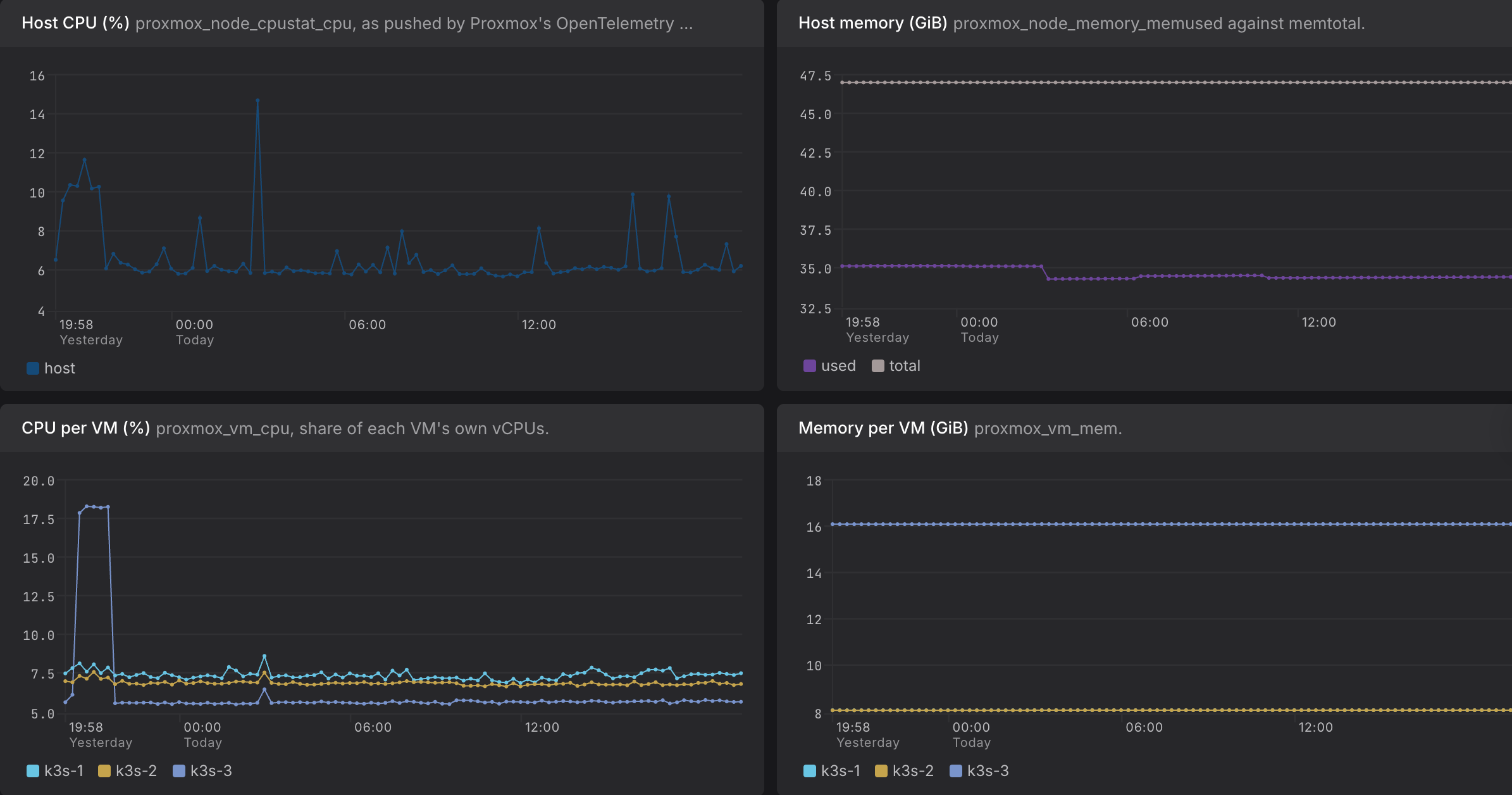
This one surprised me. Proxmox VE has a built-in metric server, and one of its types is OpenTelemetry. You don’t run an agent or an exporter. You point it at an OTLP endpoint and it pushes host, VM and storage metrics.
Since the whole lab is Terraform, it’s one resource:
resource "proxmox_metrics_server" "dash0" {
  name                              = "dash0"
  type                              = "opentelemetry"
  server                            = "ingress.<region>.dash0.com"
  port                              = 443
  opentelemetry_proto               = "https"
  opentelemetry_path                = "/v1/metrics"
  opentelemetry_headers             = base64encode(jsonencode({ Authorization = "Bearer ${var.dash0_token}" }))
  opentelemetry_resource_attributes = base64encode(jsonencode({ "deployment.environment.name" = "homelab" }))
}
Let’s break down this configuration. The headers and resource attributes are base64-encoded JSON, because that’s how the Proxmox API expects them. The resource attribute is the part I like most: everything coming from the host is tagged with deployment.environment.name=homelab right at the source, so I never have to guess where a series came from.
The cluster: one operator, every namespace
Inside the cluster, the Dash0 operator does most of the work. It runs the OpenTelemetry collectors and collects metrics, logs and Kubernetes events from every namespace. I didn’t want to remember to opt new apps in, so I flipped it: every namespace is monitored unless it’s explicitly labeled out.
operator:
  clusterName: homelab
  autoMonitorNamespaces:
    enabled: true # every namespace, unless labeled dash0.com/enable=false
  prometheusCrdSupportEnabled: true # PrometheusRules in git become alert rules
  signalControl:
    enabled: true # in-cluster tail sampling, more on that below
Traces: the components already knew how
This is where the “no instrumentation” idea really paid off. Three components I run anyway can emit OTLP traces natively. They just need to be told where to send them:
- Traefik, the ingress that k3s bundles. Every request through it becomes a trace root, and the context propagates to the backends.
- ArgoCD, so I can see what a sync is actually doing.
- The kube-apiserver, which gets a tracing config passed straight through by k3s.
The kube-apiserver one is my favorite, because it’s two small files written before k3s is even installed. The first one is a standard Kubernetes tracing config, pointing at the collector on the node:
# /etc/rancher/k3s/tracing.yaml
apiVersion: apiserver.config.k8s.io/v1
kind: TracingConfiguration
endpoint: <node-ip>:40317
samplingRatePerMillion: 1000000
And the second one tells k3s to hand it to the API server:
# /etc/rancher/k3s/config.yaml
kube-apiserver-arg:
  - tracing-config-file=/etc/rancher/k3s/tracing.yaml
Notice the samplingRatePerMillion: 1000000. That’s 100%. Same for Traefik. In a homelab that would still be fine for a while, but it’s the wrong habit, and it brings us to the part where I had to actually make decisions.
Logs: JSON where it’s possible, honesty where it isn’t
Logs were the most tedious part, and I’m not going to pretend otherwise. My rule was JSON wherever the component allows it, because with structured logs I can filter on fields instead of grepping text.
ArgoCD, Traefik, cert-manager and the in-cluster collectors all got there with a flag or a chart value. Some didn’t: k3s’s bundled CoreDNS, metrics-server and local-path-provisioner are manifests that k3s reapplies, ArgoCD’s Redis has no option, and neither do the Dash0 operator’s own collectors. I wrote that list down in the repo’s README instead of fighting it, and I think that’s the healthy thing to do: know which logs are structured and which ones aren’t, and stop there.
Keeping less: tail sampling in the cluster
Sending 100% of traces from the edge is the right default only if something downstream decides what to keep. In my case that’s Dash0 Signal Control, running inside the cluster, looking at whole traces before they leave.
The rules are plain Kubernetes resources in git, one Dash0SamplingRule per decision. A trace is kept if any rule matches, so it’s easier to look at them one at a time.
Keep every error
Any trace with an error is kept, up to 20 per minute. Errors are the traces I actually want to open, but the cap matters: a crash loop shouldn’t be able to flood anything.
apiVersion: operator.dash0.com/v1alpha1
kind: Dash0SamplingRule
metadata:
  name: keep-errors
  namespace: monitoring
spec:
  enabled: true
  display:
    name: Keep traces with errors (max 20/min)
  conditions:
    kind: error
    spec: {}
  rateLimit:
    rate: 20
Keep the slow ones
This one uses an OTTL condition: if any span in the trace took longer than two seconds, the whole trace is kept, up to 10 per minute. The timestamps are in nanoseconds, so two seconds becomes 2000000000.
apiVersion: operator.dash0.com/v1alpha1
kind: Dash0SamplingRule
metadata:
  name: keep-slow
  namespace: monitoring
spec:
  enabled: true
  display:
    name: Keep traces with a span slower than 2s (max 10/min)
  conditions:
    kind: ottl
    spec:
      ottl: span.end_time_unix_nano - span.start_time_unix_nano > 2000000000
  rateLimit:
    rate: 10
And a little bit of everything else
The last rule keeps 1% of the traces that matched nothing else, so I still have a few examples of what “normal” looks like.
apiVersion: operator.dash0.com/v1alpha1
kind: Dash0SamplingRule
metadata:
  name: baseline
  namespace: monitoring
spec:
  enabled: true
  display:
    name: Keep 1% of everything else
  conditions:
    kind: probabilistic
    spec:
      rate: "0.01"
Why this is safe
RED metrics (rate, errors and duration) are computed before sampling. So the request rates and latency percentiles stay exact, and the traces I keep are just what they should be: examples to investigate with.
Alerts as code
The last piece was alerts. I already had the Prometheus Operator CRDs in the cluster, so alerts are PrometheusRule resources in git, and the operator syncs them to Dash0 as check rules. Here’s the one that tells me the host itself went quiet:
- alert: Proxmox host not reporting
  expr: 'absent({otel_metric_name="proxmox_node_uptime"})'
  for: 10m
  annotations:
    summary: "Proxmox host sent no metrics for 10 minutes"
    description: "The host is down, or its OpenTelemetry metric server stopped exporting."
The rest cover what I actually care about at home: nodes not ready, disks and Proxmox storage filling up, pods crash looping, and certificates about to expire. They’re delivered by email, because a homelab doesn’t deserve a pager.
Conclusion
Almost everything in this lab reached Dash0 without a single line of instrumentation: Proxmox pushes OTLP natively, the operator collects the cluster, and Traefik, ArgoCD and the kube-apiserver already knew how to emit traces. Most of my time went into deciding what not to keep, and writing that down in git where I can review it like any other change.
I do believe a homelab is the best place to build these habits, because nothing is at stake and you still get to feel every trade-off. In the next post I’ll add the noisiest tenant this lab has ever had: an LLM running on a GPU from 2017. If you’ve got questions or want to share how you observe your own lab, reach out on LinkedIn. 🚀