Observability beyond the three pillars — Profiling in da house.
- Nicolas takashi
- Observability
- January 17, 2023
Table of Contents
Observability is often described as having three pillars: logs, metrics, and tracing. While these three elements are crucial to a comprehensive observability strategy, there is more to observability than just these pillars. This is something that Charity Majors talks since a long time, as you can see.
✨THERE ARE NO✨
— Charity Majors (@mipsytipsy) September 25, 2018
✨THREE PILLARS OF✨
✨OBSERVABILITY.✨
and the fact that everybody keeps blindly repeating this mantra (and cargo culting these primitives) is probably why our observability tooling is 10 years behind the rest of our software tool chain. https://t.co/94yDBPuDRv
Today I’ll introduce you to Profiling as another observability signal to help you deeply understand your service and get even more insights about your platform healthy, going beyond the three pillars and building a truly holistic approach to monitor and understand your system.
What is Profiling? 🤔
Profiling is a technique used in software development to measure code performance, identify bottlenecks, and optimize an application’s overall performance. This is accomplished by running an application and collecting data on various aspects of its performance, such as memory usage, CPU utilization, and execution time for specific functions or blocks of code.
This is useful when you are facing memory leaks or high CPU consumption, and would like to understand which part of the code is consuming the most resources, and it usually starts from a flame graph analysis.
WTH is a Flame graph 🔥
No worries at all if you’re not familiar with flame graphs, it usually scares a lot of people at the first time, but after you understand, it becomes very intuitive.
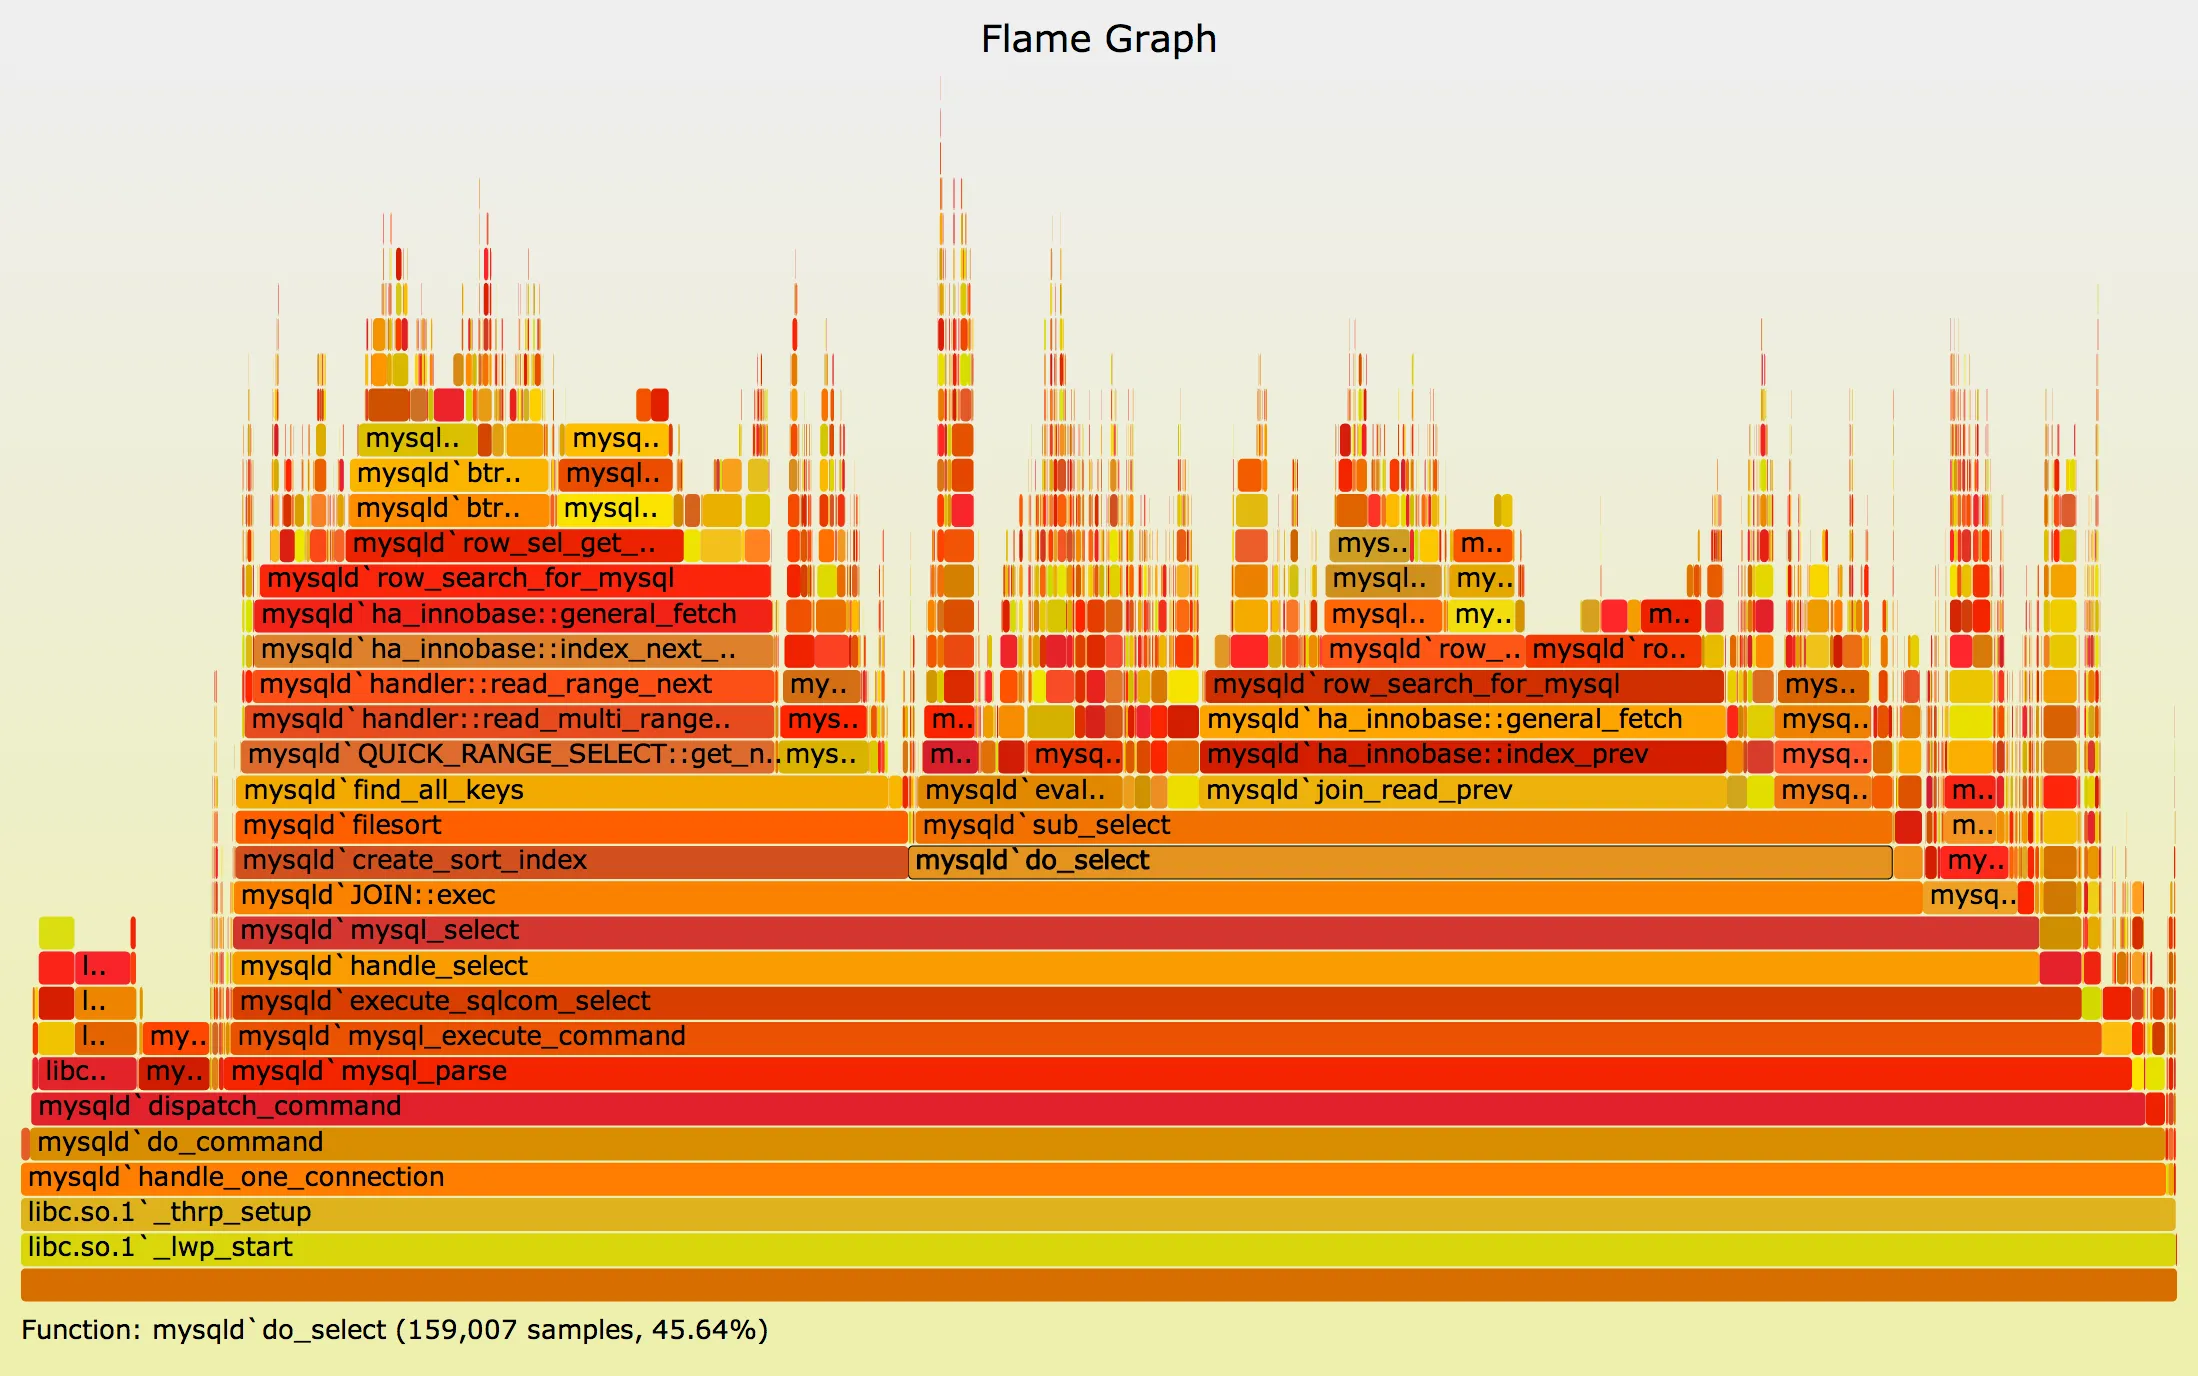
After the collection of information I described above, engineers analyze it using a flame graph, as in the example below.

Flame graphs are used by profiling tools to visualize a request’s execution path and combine its various service calls. Each bar, on the flame graph, represents a single unit of work, such as an API call or database query, that occurred while the function is processed. The bars in the flame graph are arranged in a specific order. If you want to know in more detail how to read flame graphs, I do recommend you check this blog post published by Datadog.
Profiling Strategies 👩💻
There are mainly three profiling strategies, tracing, instrumenting, and sampling profiler, we will go through those strategies to understand them a little bit more.
Tracing Profilers
Tracing profiling involves tracing an application’s execution and recording data about the flow of control, the application’s behavior at specific points in time, and the performance of specific operations, and it is commonly used to diagnose performance problems in an application, such as slowdowns or errors, and also to understand the application behavior at a high level, the overhead on this strategy will depend on the level of detail you want to have.
Instrumenting Profilers
Instrumenting profiling, as the name implies, is a strategy that involves adding instrumentation code to the application, which includes information such as the time spent executing individual functions, the amount of memory used, and the number of I/O operations performed.
This is without a doubt one of the most expensive profiling techniques, but it also provides deep visibility into your code, as it typically detects problems that high-level profiling techniques do not.
Sampling Profilers
Sampling profiling is a method of understanding an application’s performance without adding significant overhead to the application, as opposed to instrumenting or tracing profiling. It involves collecting a series of samples from an application while it is running.
When using the sampling profiler, the most common type is CPU profiling, which is the amount of time the CPU spends executing a specific piece of code. It can also include memory allocations or breaking down how much memory is currently being held by a program, which is commonly referred to as heap profiling.
Profiling challenges 🏗
Every observability signal has associated challenges, and this is no different from profiling data; we will see some of the challenges we typically face when profiling applications.
Overhead
Depending on the profiling strategy, it can significantly impact the application performance and add additional overhead, making it challenging to gather accurate data.
Complexity
Profiling complex and multi-threaded applications can be difficult due to their dynamic behavior.
Lack of visibility
Most available tools for application profiling rely on a manual process in which the engineer must trigger a command to collect the data, making the analysis more difficult and making it easy to miss the time to collect data.
Continuous Profiling for the rescue 🎏
Continuous profiling is a technique for profiling applications in which performance data is collected and analyzed continuously, rather than at specific points in time, with the goal of obtaining a near real-time understanding of application performance.
Continuous profiling tools are typically designed to add little overhead to the profiled application, while also making the correlation process with other observability signals easier because they are easily integrated into the SDLC.
Continuous profiling also provides several benefits, such as:
Real-time insight
By collecting performance data continuously, continuous profiling provides real-time insight into the performance of an application.
Early warning
By monitoring performance continuously, continuous profiling provides early warning of performance issues, allowing developers to address them before they become significant problems.
Improve SDLC
By providing real-time insight into the performance of an application, continuous profiling can help developers to optimize their code more quickly and effectively, improving the overall speed of development.
Industry support for continuous profiling 💸
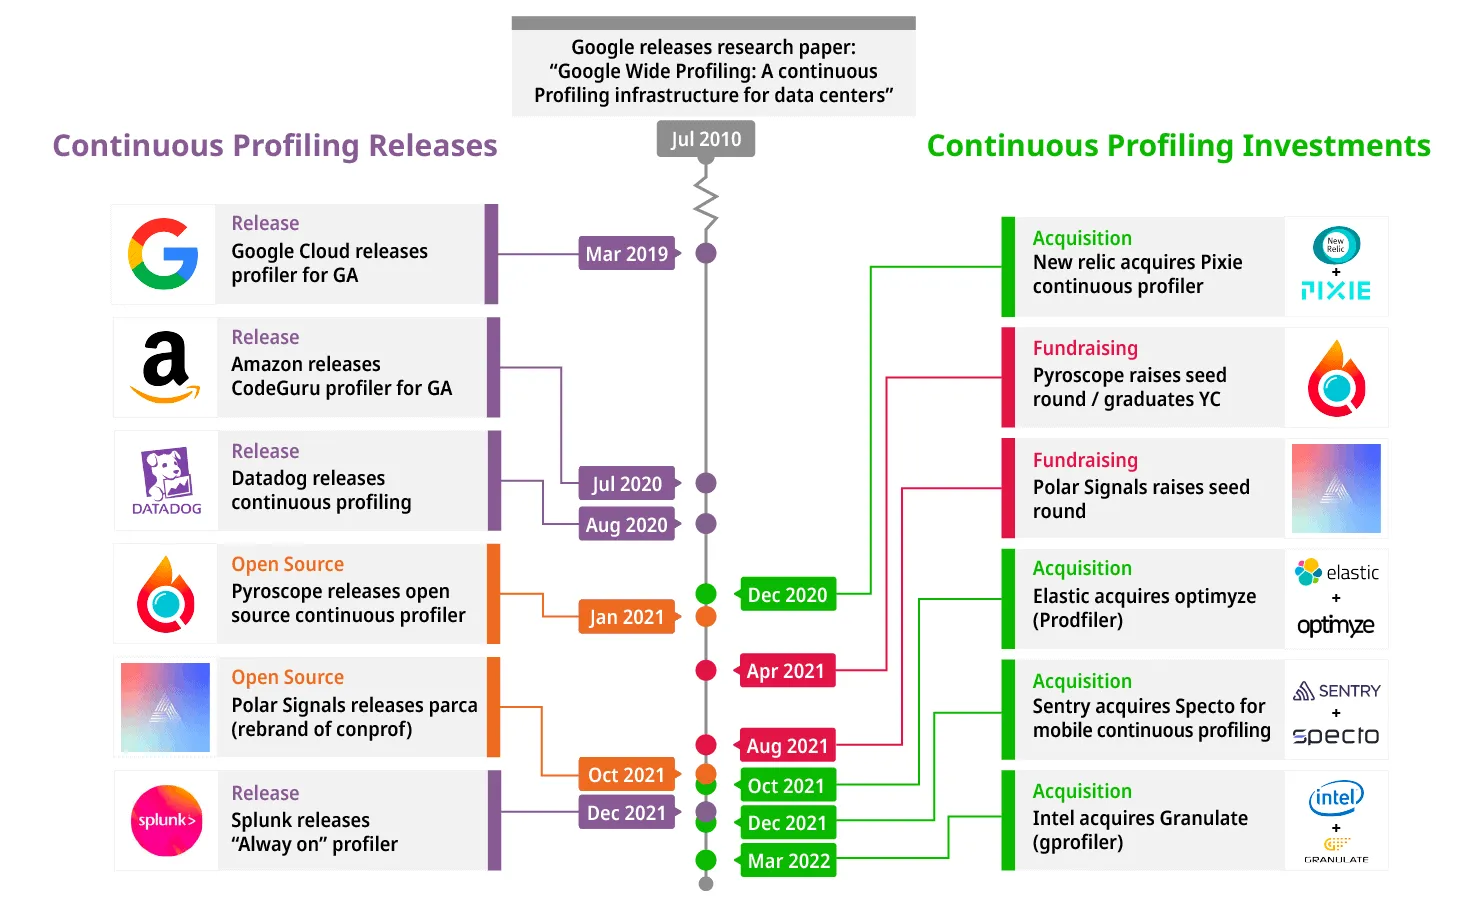
You may believe that continuous profiling is a new concept, but it has been around since Google published a paper in 2010 titled “Google Wide Profiling: A Continuous Profiling Infrastructure for Data Centers” discussing the benefits of incorporating continuous profiling into your observability pipeline.
Since then, different companies and open-source projects have joined that journey of continuous profiling space, as you can see in the timeline image below.

Open-source tools 🆓
Most major O11y vendors now provide profiling solutions, but our goal here is to demonstrate how to achieve O11y using open-source solutions, and we have a short list of the most well-known projects below.
Pyroscope
Pyroscope is an open-source project focused on continuous profiling released in Jun of 2021, and it’s leveraging eBPF to achieve low overhead profiling.
Parca
Parca is an open-source project focused on continuous profiling release in October of 2021, and it’s leveraging eBPF to achieve low-level overhead profiling, as well as Pyroscope
Pixie
Pixie is an open-source project that offers continuous profiling features, but not only this, Pixie was released in 2018 and acquired by New Relic in 2020.
If you want to see Pixie in practice, feel free to check my post about Observability strategies to not overload engineering teams — eBPF and let me know what you think about it.
Conclusion 🙇
Well, seems it’s time to take a break, we already covered a lot of things here, and we need to digest all those things before we keep talking about continuous profiling.
Did you already know about continuous profiling and the industry traction about this? Let me know in the comments down below, and I hope you have enjoyed it 😃.
In the next blog post, I’ll introduce you in more detail to Pyroscope and how we can leverage it to help us give deep visibility about application and infrastructure.